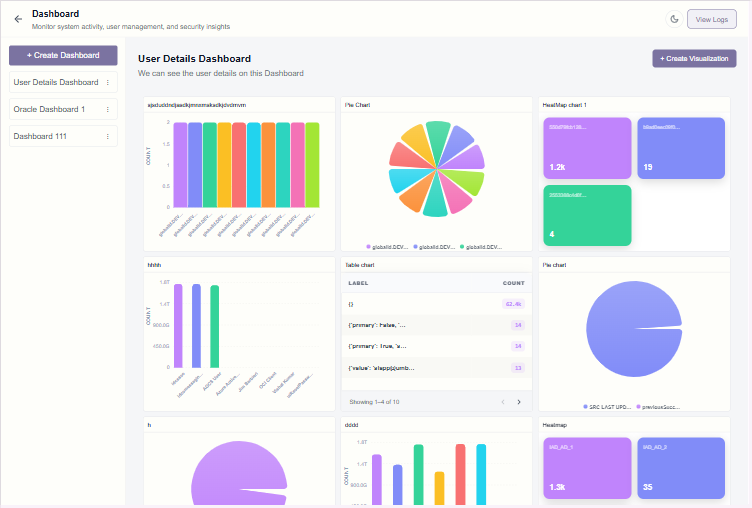
Gain immediate

visibility into the

heartbeat of your

enterprise.

Our high-fidelity dashboards translate raw cryptographic events into actionable executive insights. Build the exact view your team needs, pin it in seconds, and watch it stay current on its own — no engineering ticket required.

Every dataset deserves the right chart, not a default one.

Hue Logics ships a full visualization library so a dashboard can say exactly what the data means — not just display it.

 
Bar Chart — compare values across categories

Pie & Donut Chart — show proportion at a glance

Stat Cards — surface the one number that matters

Line Chart — track a metric’s movement over time

Table View — dig into the raw, sortable records

Auto-refresh — every widget updates on its own

Built for the executive view and the

deep dive, on the same screen.

A dashboard in Hue Logics is more than a chart wall — it’s an organized, permissioned, self-updating view into your identity data.

Build dashboards without waiting on engineering

Hit “+ Create Dashboard,” name it, and start adding widgets. Each dashboard is saved automatically and listed in the sidebar for one-click switching — build a view for user details today and an audit rollup tomorrow, all without a single line of code.

Predictive Analysis

AI-driven forecasts for potential credential exhaustion, flagging risk before it becomes an incident.

Live, auto-refreshing widgets

Every chart pulls current data on its own schedule, so the number on screen is the number that’s true right now

Role-scoped visibility

Dashboards and the widgets on them only ever surface data a viewer is permitted to see — no separate access layer to maintain.

From raw events to a pinned insight.

Every widget on every dashboard runs through the same four-step pass, whether it’s a single stat card or a full audit rollup.

01

Create Dashboard

Set up a dashboard with a name and description to organize related analytics and reports.

02

Configure Chart

Define the visualization, select the chart type, and map the required data fields and metrics.

03

Preview Results

Review the generated visualization to ensure the data and chart accurately represent your requirements.

04

Add to Dashboard

Submit the visualization to publish it on the dashboard for ongoing monitoring and insights.

See Dashboard & Analytics on your own data.

Request a demo and build your first live dashboard in the session.