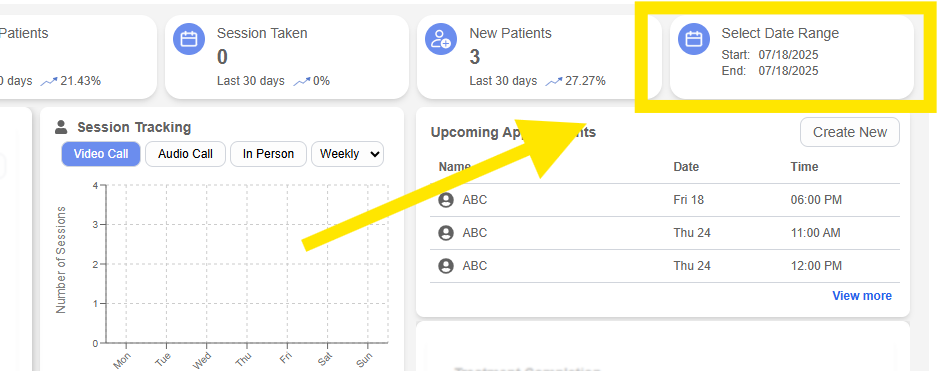
Welcome to your personalized dashboard — designed to give you a powerful overview of your clinic’s activity and patient engagement. Our dashboard provides a comprehensive overview of patient activity and session tracking within your platform easy for therapist to track there patients.
At the top, you’re greeted by name along with key performance indicators:
Date Range: Filter insights based on a custom time frame.
Total Patients: See how many patients you’ve worked with.
Sessions Taken: Track your session volume.
New Patients: Monitor growth in your client base.
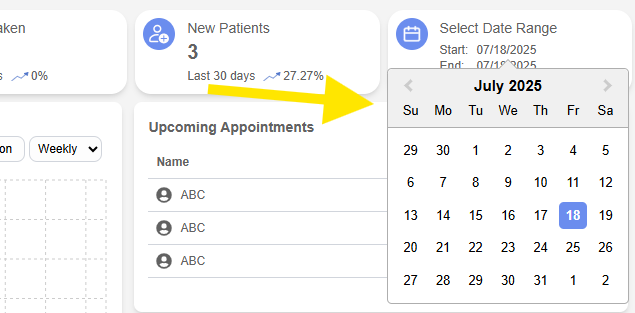
How to Use Date Range:
Click the Date Field
Tap or click on the date input box where you see the label for start or end date.
A Calendar Will Pop Up
A small, interactive calendar will appear, allowing you to navigate through months easily.
Select the Start Date
Click the desired start date from the calendar.
Then Select the End Date
After selecting the start, choose the end date to complete the range.
Session #
Session tracking is categorized into Video Call, Audio Call, and In-Person formats, with weekly data shown in a graph.
Quickly compare how many sessions were done via Video Call, Audio Call, or In Person, with a clean weekly graph for clarity.
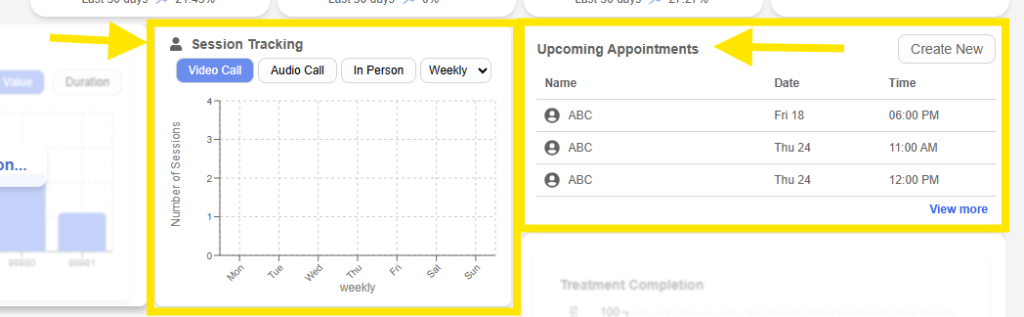
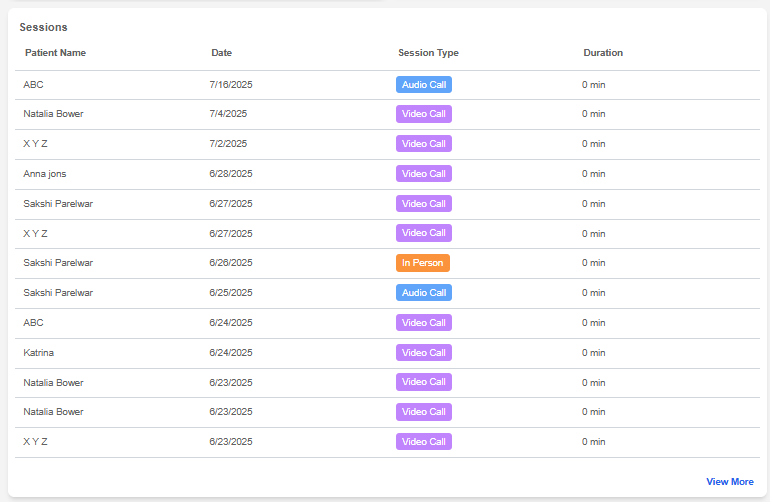
The “Upcoming Appointments” section lists scheduled sessions with patient names, dates, and times. Below that, a “Sessions” table logs previous sessions, showing patient names, dates, session types, and durations, offering a clear snapshot of past interactions. Overall, the dashboard is designed to give you quick insights into patient engagement and therapy session trends.
This dashboard is your command center — everything you need to stay informed, organized, and in control.
✨ Coming Soon:
Exciting visual insights are on the way! The dashboard will soon include interactive charts for Reimbursement, Treatment Completion, and Patient Satisfaction — empowering you with clearer data for smarter decisions, and a better overview of patient progress. Stay tuned as we roll out these powerful analytics features!


